Statistics on Income Tax Returns, Forms, Collections
Taxes are important, but they are often the last thing on people's minds. Just take a look at today's Taxpayer Roadmap - it's a tax jungle! Learn more about tax history and the tax code in the United States or see tax returns by U.S. presidents over time. The history of eFile or electronic tax filing started around 1987; see tax return e-file statistics and direct deposit information.
According to a recent WalletHub survey, if given a choice, people would rather do any of the following than their taxes:
- Jury duty: 49%
- Talk to their kids about sex: 36%
- Miss a connecting flight: 26%
- Spend the night in jail: 16%
- Swim with sharks: 15%
- Drink expired milk: 13%

Click image to enlarge
The WalletHub survey also asked people about their biggest Tax Day fears, and here are the results:
- Not having enough money: 34%
- Making a math mistake: 23%
- Getting audited: 22%.
- Identity theft: 21%.
If you would rather do your taxes or do not have a Tax Day fear, let's get your taxes done together. eFile handles all the math and forms for you and we are here to provide support before, during, and after filing your return.
Related Articles:
Over 65 million self-prepared returns were e-filed in 2023. Do it yourself tax preparation allows individual taxpayers to file taxes without the help of a tax professional.
Why eFile? Find out!Review the IRS tax return statistics below. This page is continuously being updated as data and statics become available.
IRS Income Tax Return and Form Data by Tax Year
The table below is organized by the tax year, total tax returns (1040), e-filed tax returns designated by 1040 (e), and tax returns by expired versions of the Form 1040. Many of the Form 1040 forms have been made obsolete as the IRS simplified the Form 1040 for 2018 Returns. Note that 2023 Returns being filed during 2024 are currently being updated as the IRS provides data.
2023
101,849,000
98,4218,000
n/a
n/a
2022
162,037,000
150,448,000
n/a
n/a
2021
164,246,000
151,448,000
n/a
n/a
2020
169,098,000
152,300,000
n/a
n/a
2019
169,684,000
152,802,000
n/a
n/a
2018
155,798,000
138,217,000
n/a
n/a
2017
154,444,000
135,459,000
39,621,000
24,844,000
2016
152,235,000
132,319,000
40,007,000
23,775,000
2015
152,544,000
131,851,000
40,466,000
23,854,000
2014
150,927,000
128,784,000
40,701,000
23,218,000
2013
149,684,000
125,821,000
39,406,000
23,290,000
2012
148,203,000
119,560,000
38,234,000
23,053,000
2011
137,200,000
113,074,000
38,598,000
22,583,000
2010
145,320,000
112,203,000
40,810,000
18,010,000
As e-filing has become more trusted amongst taxpayers, the amount of e-filed tax returns has gone up while paper filed tax returns has decreased. Online tax preparation and e-filing is the simplest way you get your taxes done. Prepare and e-file your taxes on eFile.com with 100% accuracy.
IRS Income Tax Return Forms, Schedules by Tax Year
The PDF documents below show IRS statistics by tax year for each form. See how many taxpayers filed Schedule C, how many taxpayers claimed the Earned Income Tax Credit, and more.
IRS Total Gross & Net Tax Collection by Tax Year
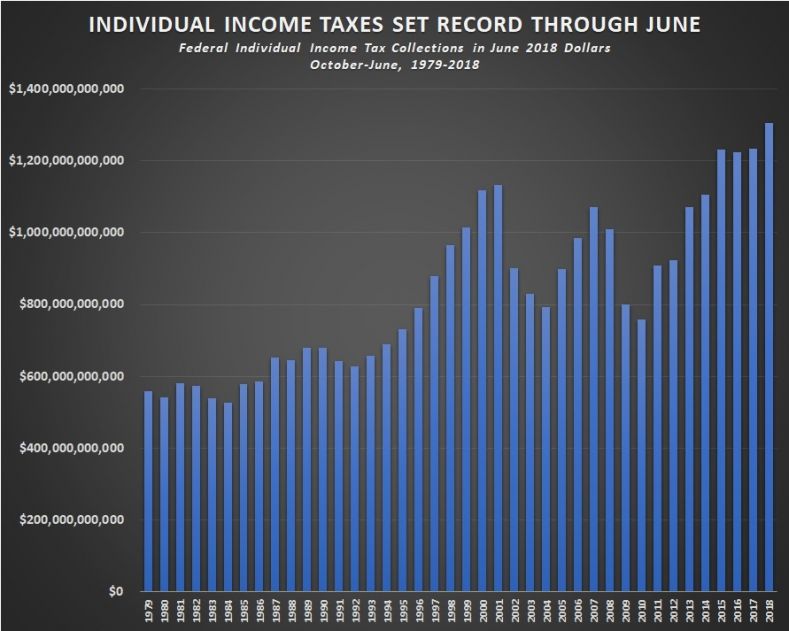
Find IRS statistics below on the amount of taxes they collected during a tax year (gross taxes), the total dollar amount of tax refunds issued, and the average refund amount. The net tax amount the IRS collects in a year would be the total gross taxes minus the amount in refunds issued. For example the IRS collected around $4.7 trillion in taxes, but issued around $271.5 billion in tax refunds for 2023 Returns. This would result in a net tax amount of $4.43 trillion the IRS collected for the year.
2023
$4.7 trillion
$271.5 billion
$3,167
2022
$4.9 trillion
$333.861 billion
$3,145
2021
$4.1 trillion
$327.263 billion
$2,816
2020
$3.5 trillion
$320.114 billion
$2,851
2019
$3.56 trillion
$269.261 billion
$2,622
2018
$3.5 trillion
$274.253 billion
$2,979
2017
$3.3 trillion
$272.980 billion
$3,031
2016
$3.4 trillion
$270.824 billion
$3,026
2015
$3.3 trillion
$317.615 billion
$2,860
2014
$3.3 trillion
$306.016 billion
$2,797
2013
$3.1 trillion
$305.734 billion
$2,792
2012
$2.9 trillion
309.648 billion
$2,984
2011
$2.5 trillion
282.813 billion
$2,707
2010
$2.4 trillion
318.529 billion
$3,109
TurboTax® is a registered trademark of Intuit, Inc.
H&R Block® is a registered trademark of HRB Innovations, Inc.